View Submittal Statistics and Graphs
1 minute
3 years ago
View Submittal Statistics and Graphs
Submittal statistics and graphs are automatically generated for each project and cannot be altered.
Note that the average turnaround statistics are calculated using calendar days. This calculation is not affected by module configuration.
To view Submittal statistics and graphs
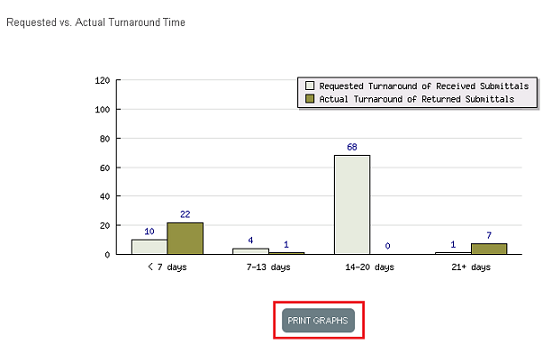
Click Stats at the top of the Submittals module to view the statistics, or Graphs to view the graphs.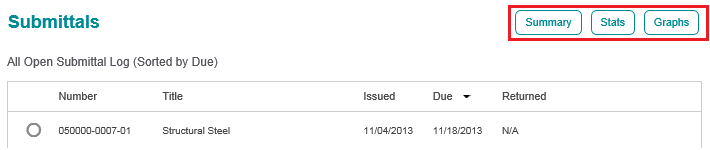
You can adjust the time frame used for the statistics and graphs from the Stats page: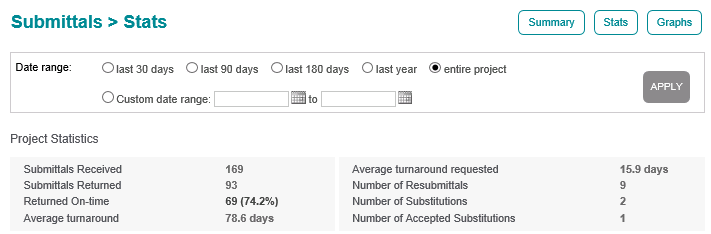
A printer friendly version of the statistics and graphs can be created by selecting Print Graphs at the bottom of the Graphs page.